Analyse-it integrates into Microsoft Excel to provide you with a wide-range of statistics and charts for visualising, describing and testing hypotheses.
Analyse-it integrates into Excel ’97 to 2007 and provides a toolbar of dataset management and statistical tests so you can analyse data directly from your worksheet. Staying in the familiar Excel environment means there is virtually no learning curve. You don't have to export your data to another package and you won't end up with your data locked into an inaccessible, proprietary, file format.
Analyse-it integrates into Excel, providing a wide-range of statistics and charts for you to explore your data and test hypotheses.
Explore, visualise and test sample distribution
Analyse-it provides extensive descriptive statistics and insightful charts for exploring samples. Statistics include the mean, median and standard deviation, all with confidence intervals, plus many non-parametric measures such as quartiles and percentiles.
Box-whisker plots, mean-plots, percentile and standard deviation plots let you see how observations are distributed and spot outliers. A frequency histogram, with optional normal curve overlay, provides an alternative view of the sample distribution. Histogram bins can be determined automatically by Analyse-it or you can enter your preferred bins.
Tests and charts include:
Summary statistics
Frequency histogram with configurable bins
Box-whisker plots, with near- and far- outliers
Dot-, Mean-, Percentile- and SD plots
1-sample z-test
1-sample t-test
Binomial test
Runs test
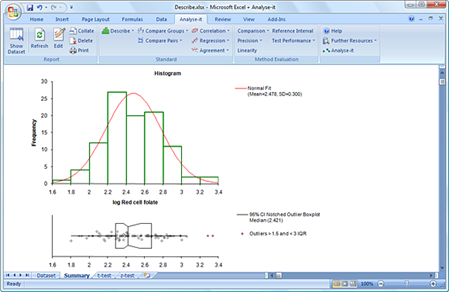
Analyse-it provides many charts for exploring and visualising your data. Frequency histogram and dot- and box-whisker plot, with notch indicating median confidence interval, are shown.
Verify pre-test assumptions of normality
Tests and charts are included for verifying a sample is normally distributed - a necessary step when using parametric statistics. Hypothesis tests are included so you can formally test normality, or you can use the normal quantile plot and frequency histogram (with normal overlay) to make a visual assessment.
Tests and charts include:
Kolmogorov-Smirnov
Shapiro-Wilk (supports up to 5,000 observations)
Anderson-Darling
Normal Quantile plot
Frequency histogram with normal overlay
Find changes and differences between groups and samples
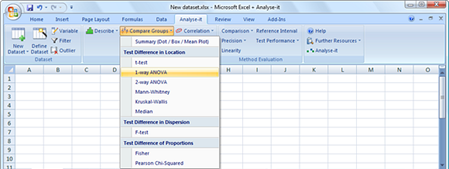
Parametric procedures including the t-test and ANOVA, with post-hoc comparisons, are provided so you can test whether groups/samples change due to a factor or over time. For non-normal and categorical data non-parametric procedures are provided, including Mann-Whitney, Kruskal-Wallis, Fisher exact, and Chi-Square.
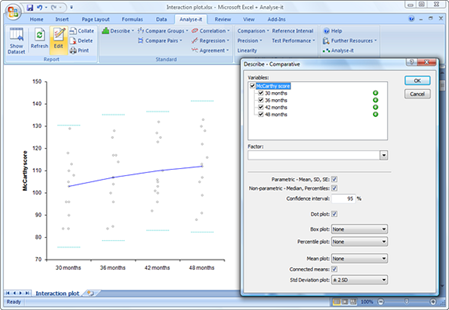
Side-by-side dot-plots, box-whisker plots and mean-plots let you visually compare samples. Interaction plots, with connected means, let you easily see whether samples or groups differ or change.
Tests and charts include:
Independent and paired t-test
Mann-Whitney and Wilcoxon Signed ranks
1-way ANOVA, with LSD, Bonferroni, Tukey, Dunnet and Scheffe post-hoc comparisons
1-way repeat-measures and 2-way ANOVA
Kruskal-Wallis and Friedman ANOVA
Sign and Median test
F- test
Fisher exact and Chi-Square
McNemar and Cochran tests
Side-by-side dot-plots, box-whisker plots, mean-plots and SD plots
Interaction plot (connected means)

Publication-quality print-ready reports
Analyse-it's perfectly formatted reports mean you can print the analysis immediately, without wasting time tidying them up for presentation. You can also copy-paste charts and statistics directly into your own documents and presentations. Chart look is based on the most popular formats used in published research, so charts are immediately ready for inclusion into research papers.
Save, exchange and update your analyses
Once analysed, your Analyse-it analyses can be saved in a standard Excel workbook, published on the intranet, or e-mailed to colleagues. Colleagues with Excel can open and print workbooks containing Analyse-it analyses, without needing Analyse-it. At any time you work with Analyse-it, you can update analysis reports, repeating the analysis to reflect changes or additions to the source data.
A proven reliable product
Analyse-it has is used by over 15,000 customers world-wide. It's widely respected by researchers and is cited in well over 1,500 published peer-reviewed papers in internationally recognised journals.
Full support and help along the way
All major upgrades to Analyse-it, released within 12 months of your purchase, are available to free of charge. Bug fixes and minor updates are available free of charge, for the lifetime of the product.
If you need help or advice on using Analyse-it, the full help and tutorials included with Analyse-it provide easy-to-understand, plain English instructions to guide you through using Analyse-it. Help on choosing a suitable statistical test, then using, interpreting, and understanding the statistics is included. Most queries are answered within a few, and almost all within 24, hours.


